Since Google announced their new initiative about including page experience KPIs in the formula they use to calculate search engine rankings, big brands relying both on SEO and advertising at the same time, are stumbling over the poor performance of their websites.
A lot of people don't read the fine print and miss the fact that currently Core Web Vitals only impact your ranking for mobile searches. This means that if you have a poor desktop score but your mobile is doing okay, you're still in the safe zone.
The bad news is that mobile web browsing has surpassed desktop browsing. That's also true for mobile searches. Many more people search on their phone rather than on their computer, simply because of the ubiquity of the phone. Face it, wherever you go, the phone goes. So that smartwatch you bought so you can stay on top of your notifications is nothing more than a nice-to-have since your phone is always on you.
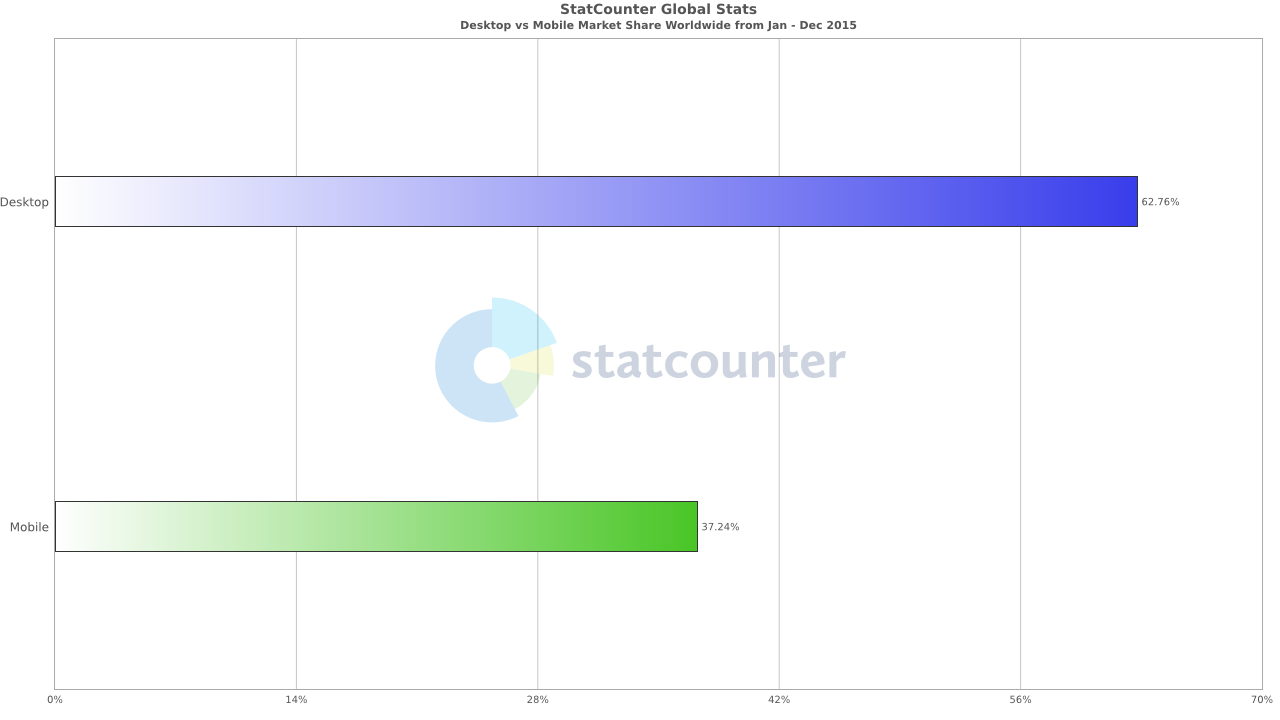
Back to the topic, here are some interetsing graphs that compare mobile browsing in 2015 to mobile browsing in the past 12 months.


That's a huge gap mobile search has been able to close and then move past!
Running a Lighthouse audit on nike.com
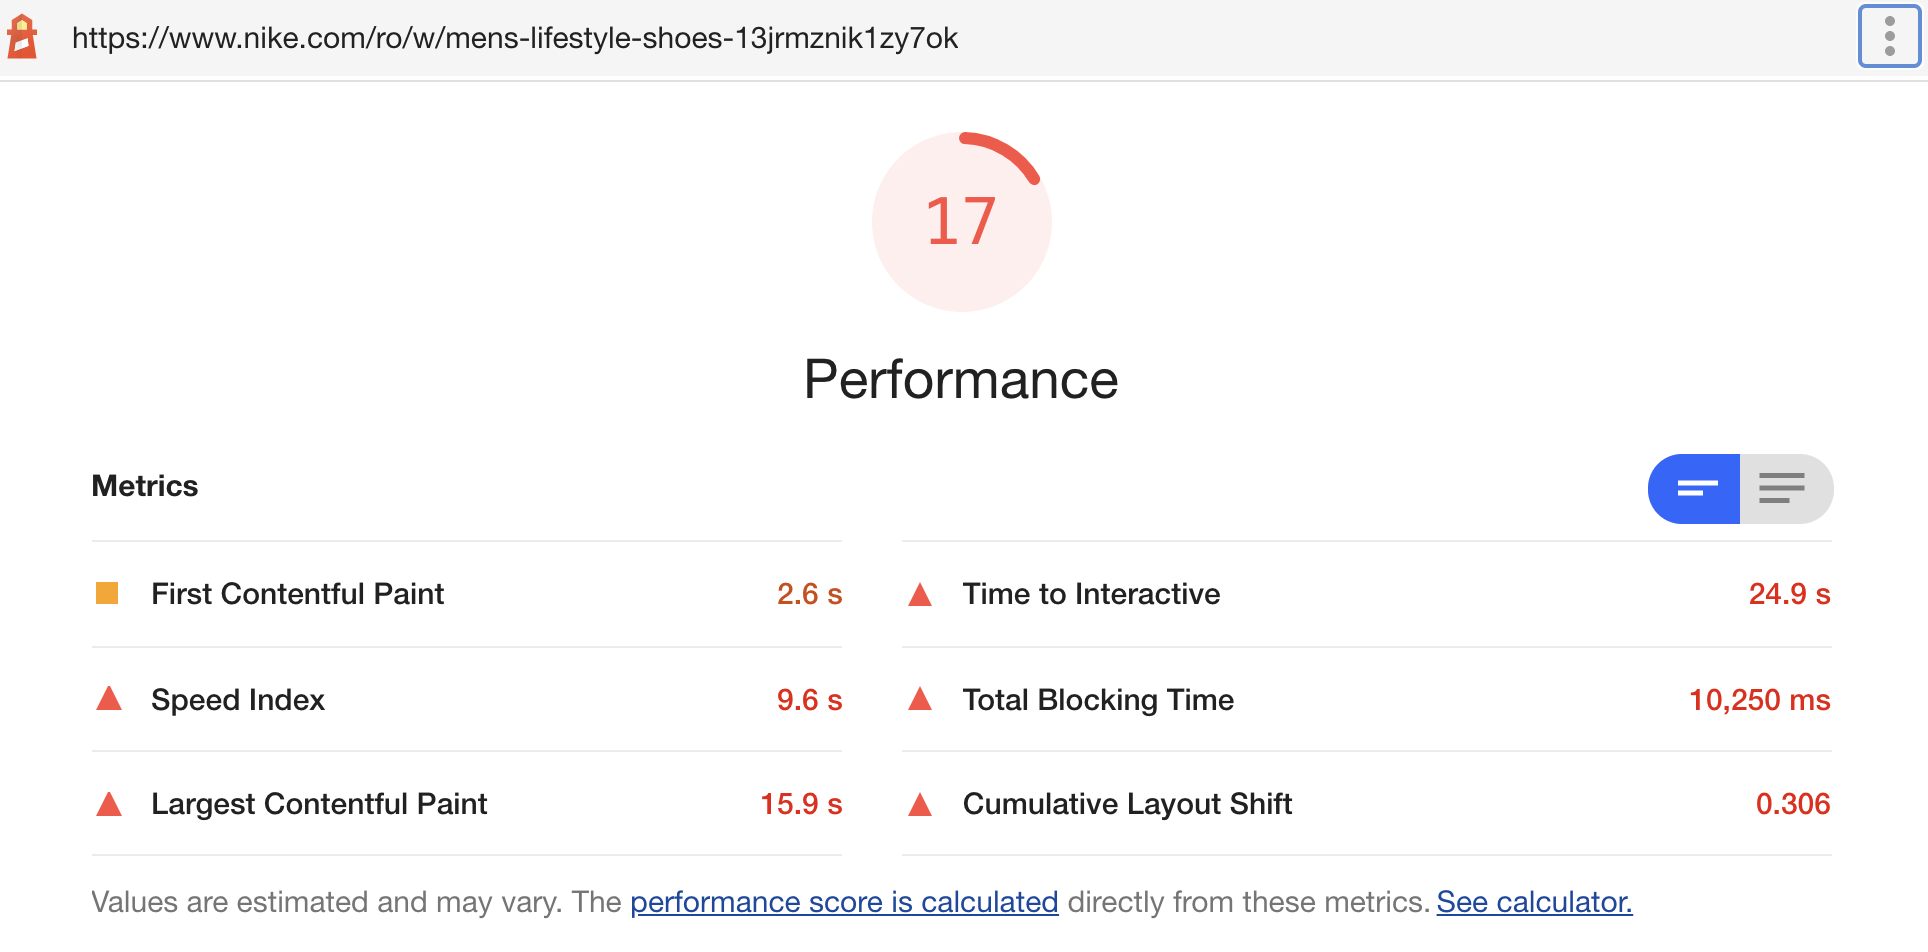
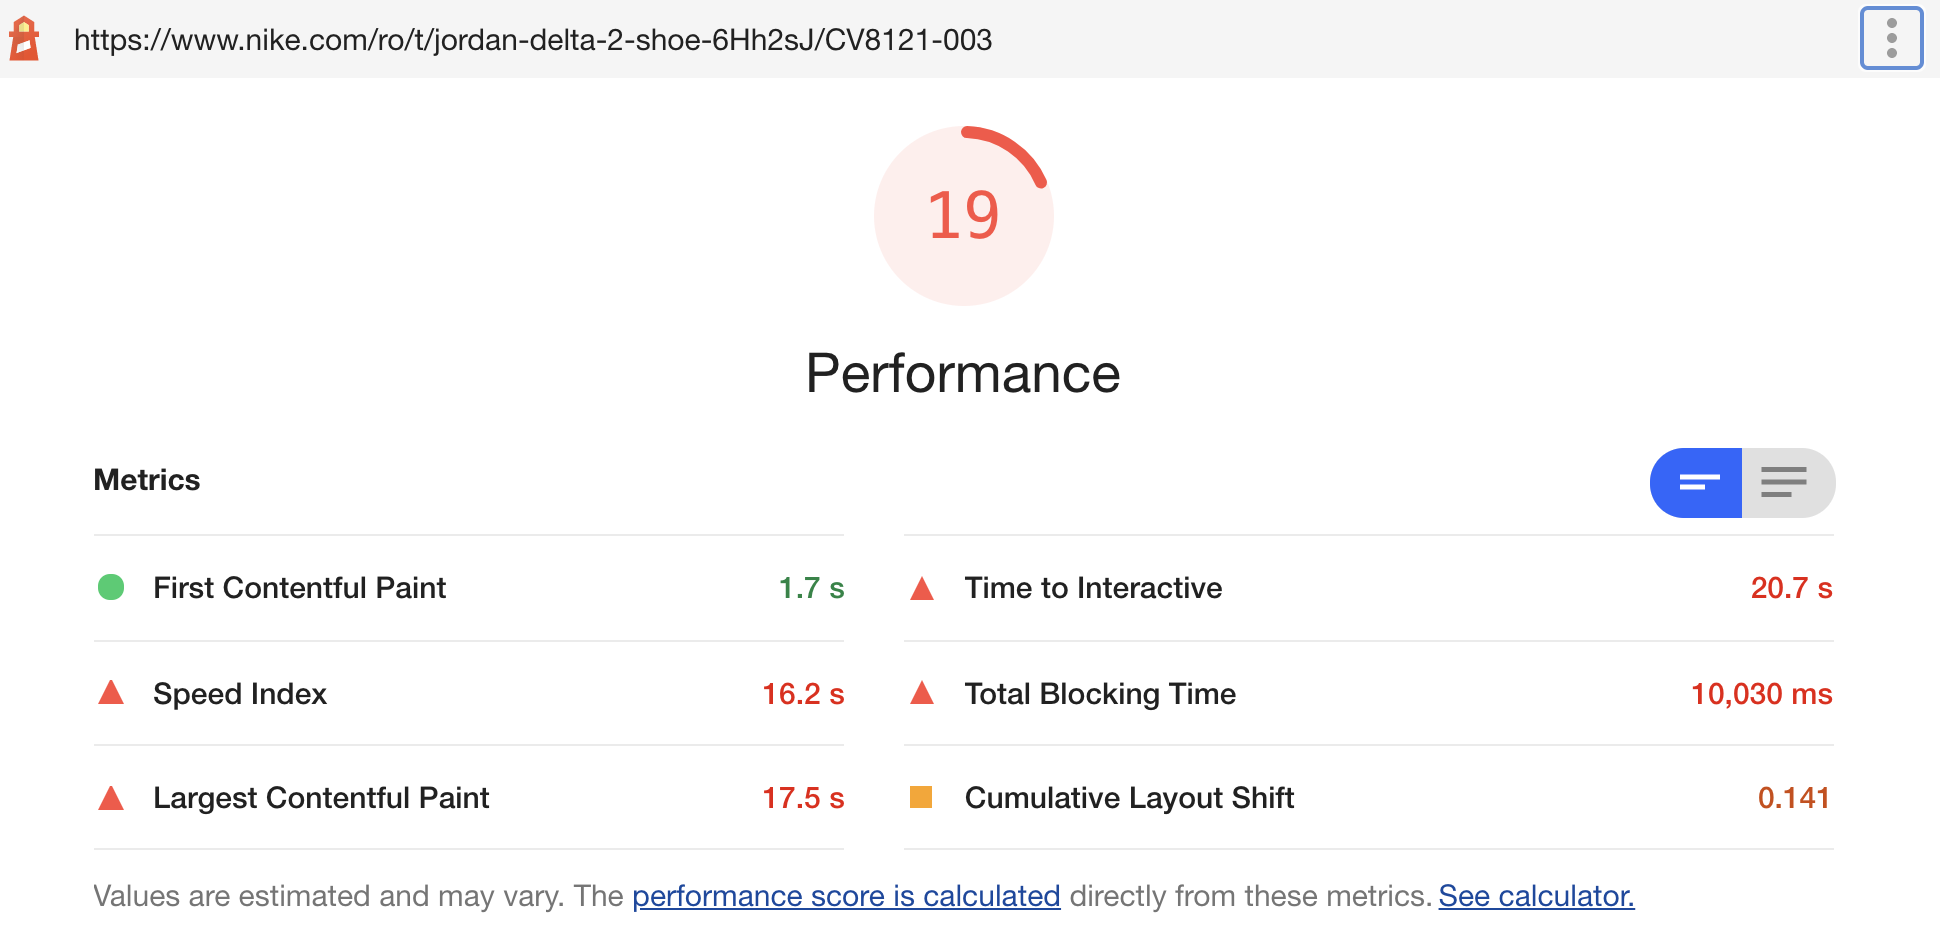
I ran a quick audit on Nike's product category page (PCP) and on their product details page (PDP). Took me a while to decide which product to audit, because I'm picky about sneakers.
The product category page obtained a really poor score according to Lighthouse:

The product detail page was no different. It's Lighthouse Core Web Vitals audit score was 2 points above the category page's score, but not enough to move it from the red zone.

The recommendation that sticks out like a sore thumb on both audits is "Remove unused JavaScript". Since Lighthouse is smart, it can tell that Nike uses React.js for their front-end so it goes along and recommends lazy loading:
If you are not server-side rendering, split your JavaScript bundles with
React.lazy(). Otherwise, code-split using a third-party library such as loadable-components.
But "unused JavaScript" is actually something you can actually quantify.
Enter Chrome DevTools Coverage report
If you have Chrome DevTools open (if not, simply press CMD+Shift+I if you're on a Mac) navigate to the Sources panel. Once you are there, hit the "Esc" key on your keyboard and that would bring up the console but with some extra tabs. One of those tabs is called "Coverage". Click on it and do as you are instructed — press the 🔄 (reload) button and wait for the page to finish loading.
After doing this you will be greeted with an amazing report which shows you how much of the current JavaScript and CSS loaded on the page is actually being used/unused.
For the product details page, it seems like more than half of any JavaScript or CSS resource loaded on the page goes unused, as you can see below.

What's even nicer is that you can literally browse the code and see which parts are not used by clicking on any of the files in the list. Assuming you have sourcemaps enabled and everything is transparent for you as a developer, you'll quickly tell what you can do away with.
How can you fix this?
The biggest thing you can do is to write your code in a tree-shake-able way. I'll write a dedicated article on that, but until then, here are some good resources:
- Wikipedia: Dead code elimination
- Webpack.js website: Tree Shaking
- How To Make Tree Shakeable Libraries
- How to write a tree-shakable component library
Another great opportunity for improvement is to identify the libraries that you're using and check whether they allow tree shaking. If they don't, see if there's a newer version that does. If that's also not available, try to find an alternative library you could migrate to, that supports tree shaking.
So you don't waste time plowing through all the libraries in your package.json you might want to install something like webpack-bundle-analyzer and look at the big offenders over there. Tackle those libraries first and you'll probably win big.
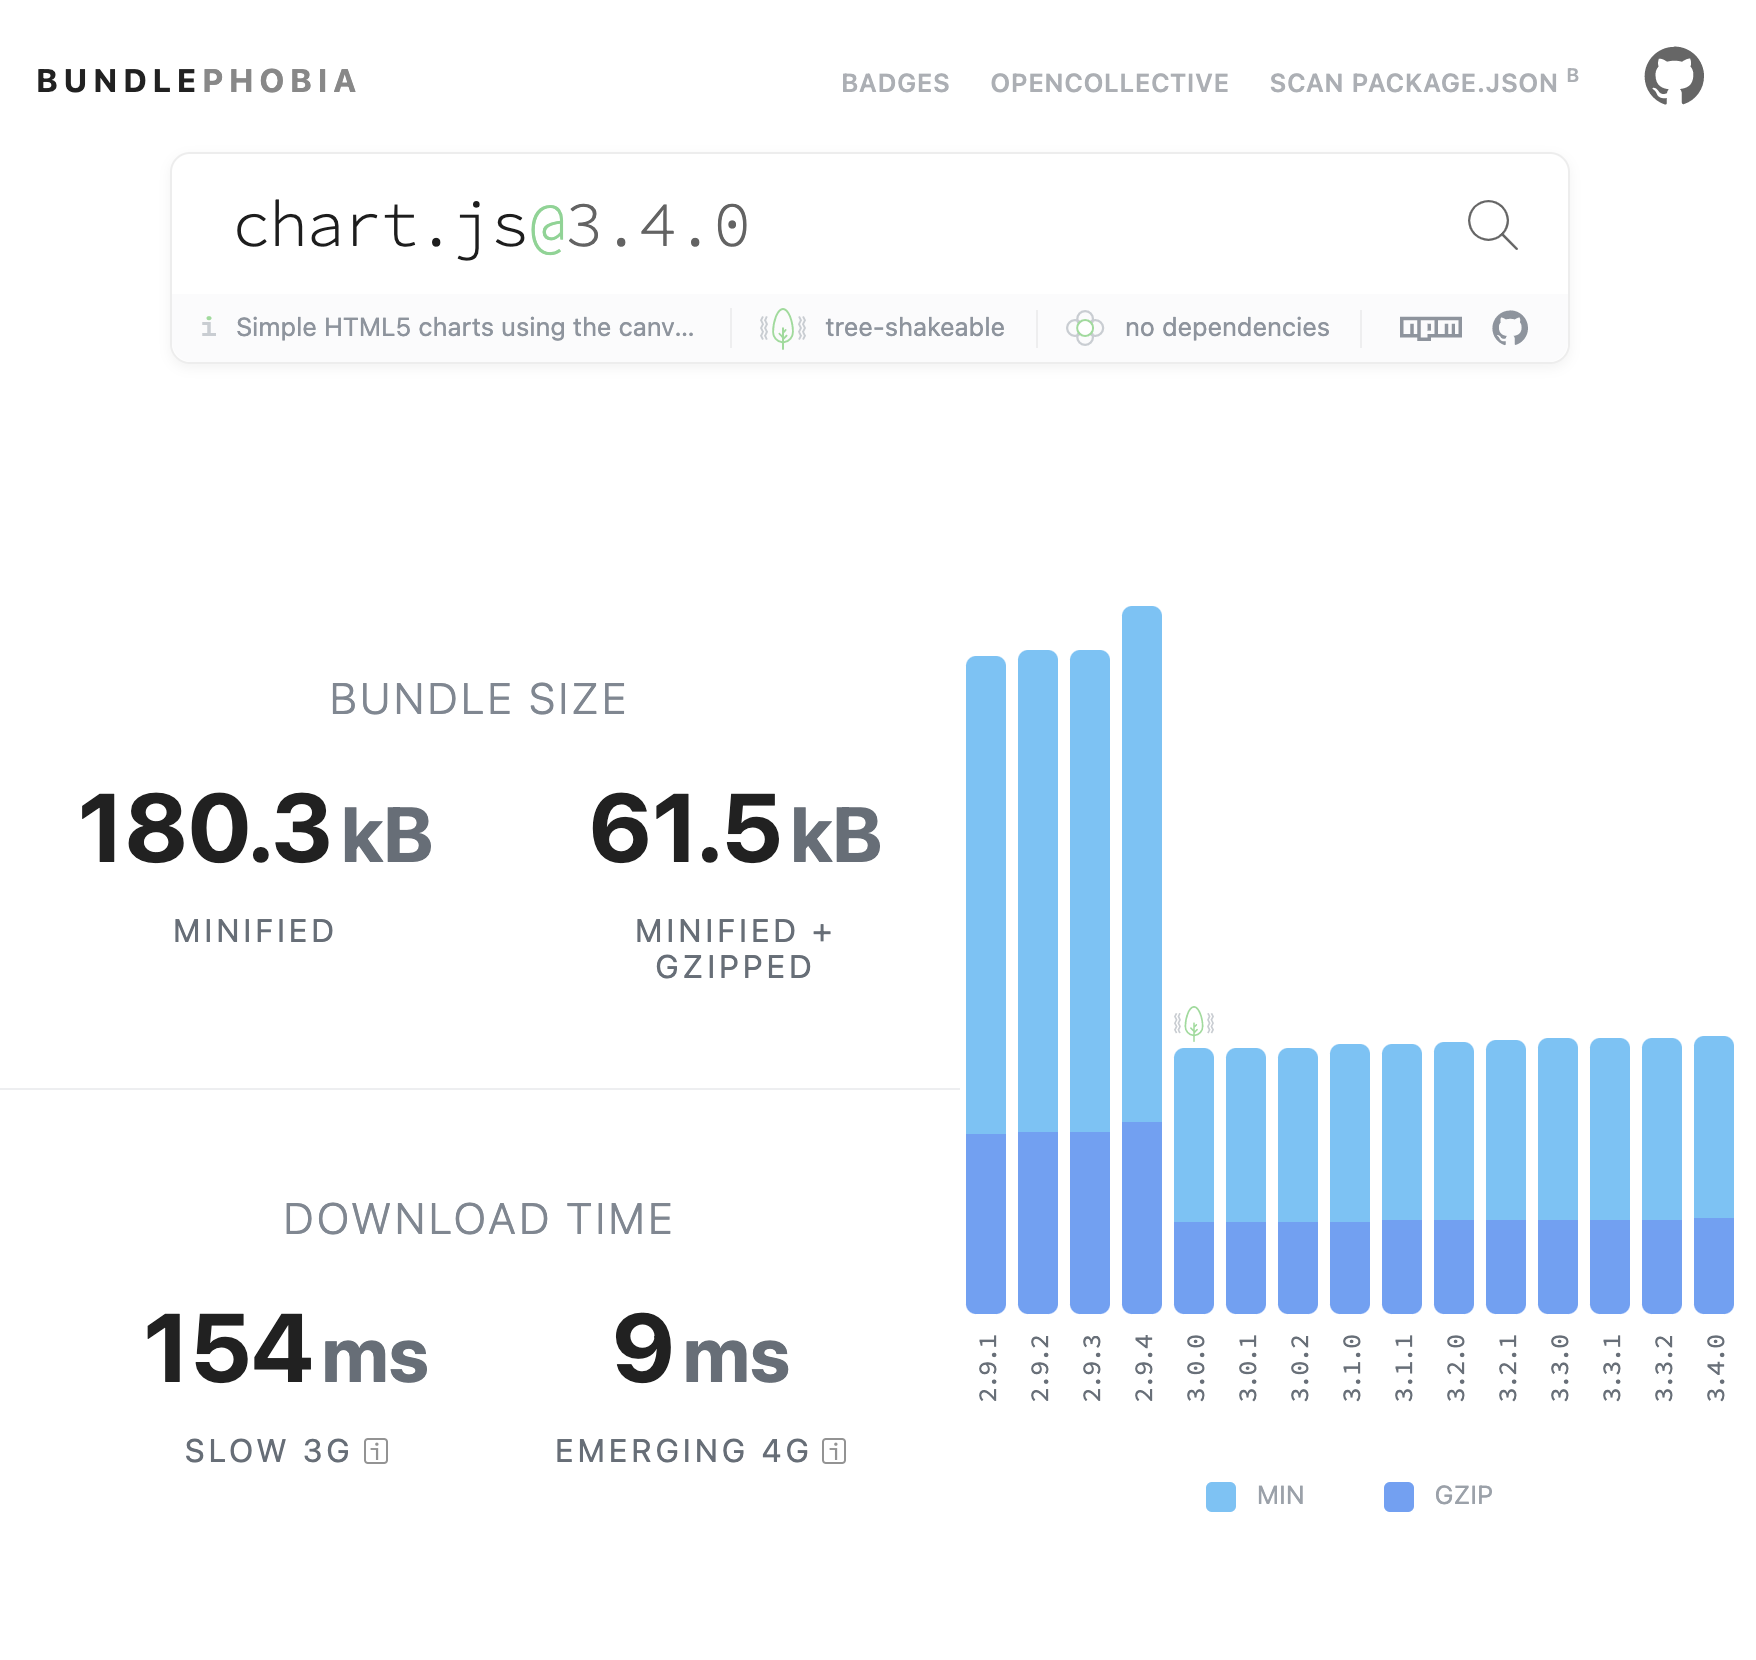
You could also rely on something like bundlephobia.com to find whether a tree-shakeable version of your library exists.
Here's what using Bundlephobia to find whether chart.js has a treeh-shake-able version looks like:

I was reviewing some code that was supposed to draw a doghnut chart of the ingredients in a given perfume, among other things. It was built using chart.js and the whole bundle had over 600kb. I got suspicious since there was very little custom code. After a closer look, I realized the library itself amounted for 3/4 of the whole bundle. I was delighted to find that the team behind the library had a tree-shake-able version in the works so I instantly updated to that version. Bundle went down to 150k, problem solved.
Closing thoughts
Unlike other initiatives from Google, Core Web Vitals doesn't seem to be the monopolistic type of move you'd expect from large companies. It actually looks like a genuine initiative to make the web better. Yes it is tied to the way they calculate ranking in search results, but it's all for the benefit of the user. Better web, better ways to run ads to the people who spend time on it. Although my last statement might sound contradicting, I think it's a fair sacrifice, if this improves the page experience for everyone else.
If you'd like to look at the summaries of the reports, you can download them below.
If you'd like to chat with me about this article, I'm on Twitter at @oprearocks and I also keep a constant presence on my Linkedin.
